TUG & TUGN Update – October 2023

Can We Count on Seasonality to Continue?
- Higher Rates Weighing on Markets
- Tech Stocks Outperforming Defensive Sectors
- Q4 Expectations
At the beginning of last quarter, we asked the question “is it too late to be a bull, too early to be a bear?” Initially, it appears the answer may be the former, as the market peaked at the end of July. Aside from energy, which benefitted from an increase in oil prices, all S&P sectors returned losses over the quarter. Defensive sectors like utilities and consumers staples performed among the worst, down -10.1% and -6.6% on the quarter.
Figure 1: 2024 terminal rates increased 1%
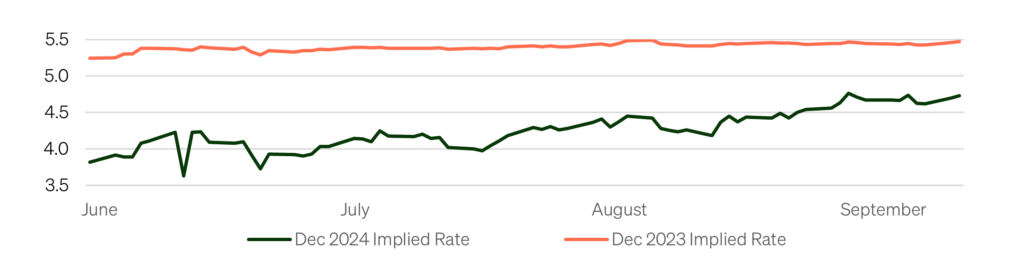
Source: Bloomberg 2023
Higher long-term rates have caused pain for bond investors and consternation for equity holders. 10-year inflation expectations have stayed relatively flat, so a rise in the 10-year yield has pushed expected real rates to their highest level since 2006. Market participants also expect short term rates to remain higher for longer as the Fed attempts to navigate a soft landing. Expectations for a 2024 terminal Fed funds rate (the market implied rate for December 2024) brose as much as 1% this quarter. Stocks fell alongside bonds as a result.
Figure 2: Real rates well above 2%
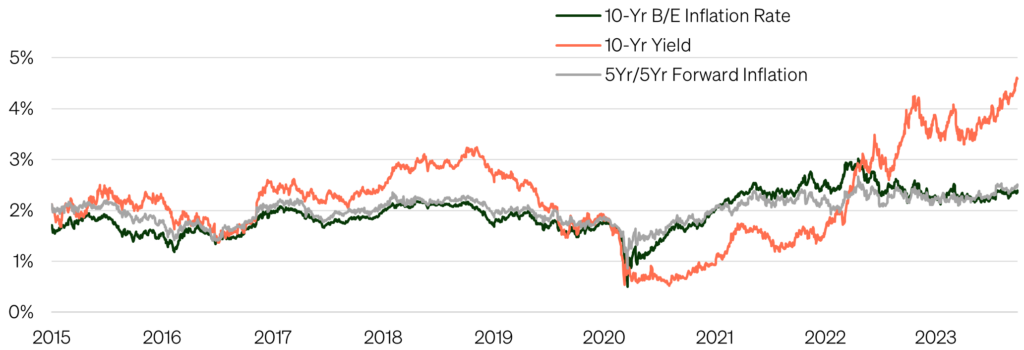
Source: Bloomberg and FRED 2023
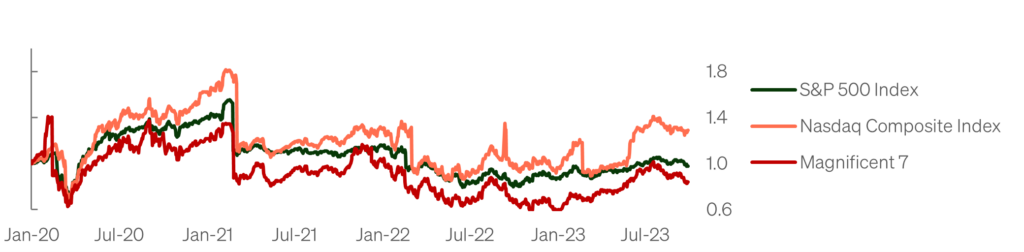
Longer term, higher interest rates tend to be poor news for stocks as they increase borrowing costs and lower the expected risk premium gained from corporate earnings over risk free returns. However, large cap tech stocks have marginally outperformed other broader indices amid rising rates. This is a key divergence from last year where the largest companies like Microsoft, Meta, and Apple fell the hardest.1
Figure 3: Tech stocks avoiding repeat of 2022
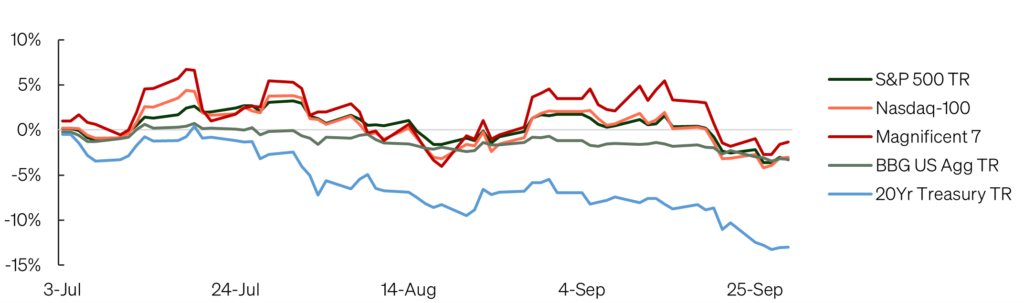
Source: Bloomberg 2023
The excitement around AI technology has been a notable catalyst for this year’s rally, but there are several fundamental data points that support their outperformance. The most important is earnings, the outlook for which has grown more optimistic as the year has progressed. Stripping out the seven largest companies in the Nasdaq-100 (the Magnificent 7 as they are referred)2, 12 month forward earnings estimates have increased nearly 300% since the start of 2020 compared to 35% for the S&P 500. Higher earnings keep P/E ratios lower, and the P/E growth of the tech indices have not significantly increased relative to the S&P 500.
Figure 4: Bloomberg estimates earnings per share (normalized)
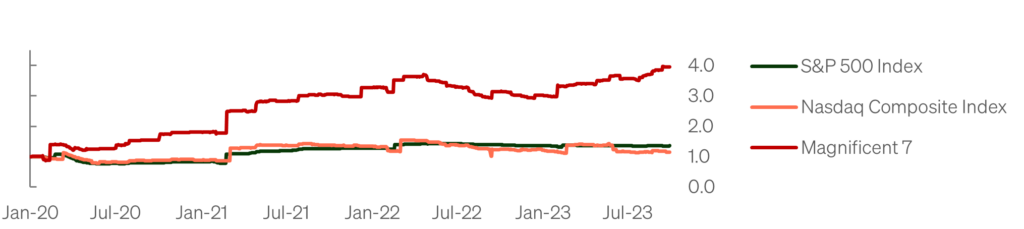
Source: Bloomberg 2023
Figure 5: Bloomberg estimates price to earnings ratios (normalized)
Source: Bloomberg 2023
Another factor that helps with rising interest rates: lower debt burdens. The largest tech companies have reduced their debt-to-equity levels by over 40% since March of 2020 while the Dow Jones companies have increased theirs by 21%. The Magnificent 7 stocks also remain some of the most well capitalized with each Magnificent 7 constituent (excluding Amazon) holding more cash than debt on their balance sheet. Companies with higher exposure to debt financing remain vulnerable to higher interest rates, explaining why utility stocks were the worst performing sector in the quarter.
Figure 6: Total debt to total equity (normalized)
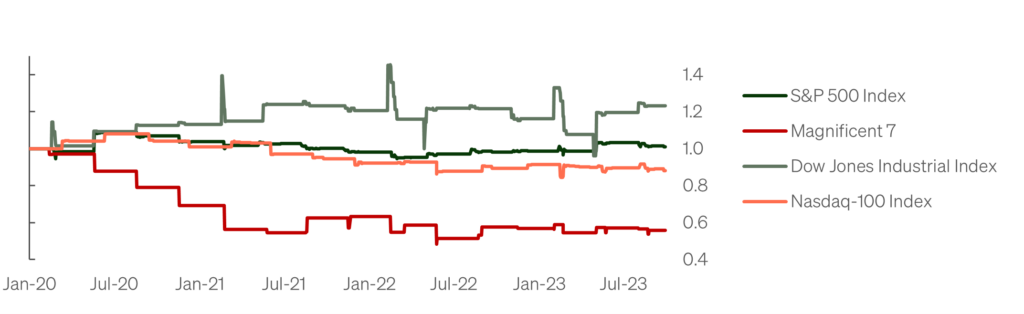
Source: Bloomberg 2023
The Fed will be closely watched to see if it decides to hike rates an additional time before year end. This will hinge on whether they find that conditions are sufficiently restrictive. The recent rise in longer duration rates, flatting an inverse yield curve, may indicate that further intervention is unnecessary. Recent inflation data has been positively received as it shows that core and wage inflation are dropping, even as food and energy continue to fluctuate.
What is next? So far, the market has followed seasonality patterns closely, so a strong fourth quarter finish should be expected if this trend were to continue. Positive stock specific news during earnings season will be one key for an end of year rally. Given how the broad S&P 500 has trailed the Nasdaq-100 and that some investors have missed the first two quarters, there is also some hope that those who have missed may now chase returns at year end.
TUG and TUGN remain long equities entering October despite September’s pullback as several indicators suggest this bull market is not quite finished. Implied equity volatility, while rising, remains low relative to past market pullbacks and is not yet signaling panic. Despite the unceasing headline risk that seems to threaten the stability of the economy and market, TUG’s advantage remains its ability to filter out the noise and react to market technicals and volatility.
Appendix
Investing in ETFs involves risk and there is no guarantee of principal.
To view the prospectus for TUG and TUGN, visit https://stfm.com/wp-content/uploads/2023/07/TUG_summary-prospectus.pdf.
The Nasdaq-100 is a market cap weighted stock market index made up of 101 equity securities issued by 100 of the largest non-financial companies listed on the Nasdaq stock exchange. The Nasdaq-100 Equal Weighted Index is an equal-weighted version of the Nasdaq-100. The S&P 500 is a stock market index tracking the stock performance of 500 of the largest companies listed on U.S. stock exchanges. The Dow Jones Industrial Average is a price-weighted measure of 30 U.S. blue-chip companies. The Nasdaq Composite Index is a market capitalization-weighted index of more than 2,500 stocks listed on the Nasdaq stock exchange.
Cash Redemption Risk. The Funds’ investment strategy may, at times, require it to redeem shares for cash or to otherwise include cash as part of its redemption proceeds. In that case, the Funds may be required to sell or unwind portfolio investments to obtain the cash needed, which may cause the Funds to recognize a capital gain that it might not have recognized if it had made a redemption in kind. Derivatives (Options) Risk. The Funds (for TUGN only) invests in options that derive their performance from that of the Nasdaq-100 Index. Derivatives may be more sensitive to changes in market conditions and may amplify risks. Selling and buying options are speculative activities and entail greater than ordinary investment risks. Fixed Income Risk. Fixed income investments are subject to changes in governmental policy and market conditions, which may cause such investments to be subject to significant volatility and reduced liquidity, depending on the environment. Large-Capitalization Investing Risk. The securities or large capitalization companies may be relatively mature compared to smaller companies and therefore subject to slower growth during times of economic expansion. Management Risk. The Funds is actively managed and may not meet its investment objective based on the Adviser’s success or failure in implementing the Funds’ strategy. Models and Data Risk. When models and data prove to be incorrect or incomplete, decisions made based on them can expose the Funds to potential risks. New Funds Risk. The Funds is recently organized with no operating history and managed by an Adviser that has not previously managed a registered Funds. As such, the Funds has no track record on which to base investment decisions.
STF Management, LP serves as the Funds’ investment adviser.
The Funds are distributed by Foreside Funds Services, LLC. Foreside is not affiliated with STF Management.