TUG & TUGN Update – January 2024

Quarter in Review
- Market Performance | Stocks rallied sharply in November and December, erasing a 10.3% drawdown from the July market highs. Core PCE Inflation dropped below 2% over six months for the first time since 2020, allowing the Fed to effectively end their rate hiking cycle. Expected rate cuts in the first half of 2024 ignited a rally in stocks and bonds, boosted by strong third quarter earnings reports.
- STF Fund Allocation | The funds made an allocation change from 100% stock to 50% stock & 50% bills on October 27th in response to rising equity volatility. The funds reallocated back to 100% stock on November 6th.
- Leaders | Semiconductor stocks continued to outperform the rest of the index along with Crowdstrike, which rose over increased cybersecurity demand.
- Detractors | Tesla and Cisco contributed most to fund underperformance while Lucid and Align Technologies were the worst performing stocks in the index.
- Options Contribution | The options overlay in TUGN contributed modestly to performance as TUGN outperformed TUG over the quarter.
2023 was one of the great years for market returns.
The Nasdaq-100 enjoyed a total annual return of 53.8%, fully erasing the losses of 2022 and setting five new record closing values, hitting a high watermark of 16,906 between Christmas and New Year’s Day. For the month of December, the index rose 5.51% and for the quarter the index gained 14.34%, ending with a nine-week winning streak.
Figure 1: 2022 – 2023 Cumulative Performance of Major Indices
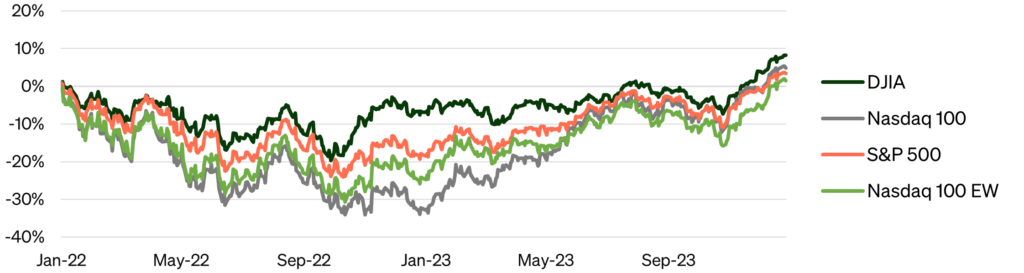
Source: Bloomberg
So, what drove the performance of this past year? Let’s examine by different time periods because some things should really stand out this way. The first chart begins with the December winners:
| Symbol | Name | 1M % Change |
| ILMN | Illumina Inc | +36.58% |
| WBA | Walgreens Boots Alliance | +30.94% |
| MRNA | Moderna Inc | +27.99% |
December produced some big winners in two beatdown sectors, healthcare, and consumer staples. In the broader indices, real estate and industrials were the top performers, representing a positive rotation after lagging information and consumer discretionary stocks. Moderna and Walgreens were particularly oversold, down -60% and -40% YTD, respectively, before their end of year rally, suggesting some short covering to end the year.
Shifting the focus to the entire 4th quarter:
| Symbol | Name | 3M % Change |
| CRWD | Crowdstrike Holdings Inc | +52.54% |
| PDD | PDD Holdings Inc | +49.19% |
| AMD | Advanced Micro Devices | +43.37% |
| INTC | Intel Corp | +41.82% |
| AVGO | Broadcom Inc | +35.01% |
| QCOM | Qualcomm Inc | +31.04% |
None of the Magnificent 7 stocks were represented in the top quintile, although AI continued to drive results. Nvidia returned 13%, but took a backseat to other semiconductor producers Intel, AMD, Broadcom, and Qualcomm.
Finally, the annual perspective for 2023:
| Symbol | Name | 1M % Change |
| NVDA | Nvidia Corp | +239.02% |
| META | Meta Platforms Inc | +194.13% |
| CRWD | Crowdstrike Holdings Inc | +142.49% |
| AMD | Advanced Micro Devices | +127.59% |
| ILMN | Illumina Inc | -31.14% |
| MRNA | Moderna Inc | -44.63% |
| JD | jd.com Inc | -50.42% |
| ENPH | Enphase Energy Inc | -53.23% |
The winners of 2023 all had AI-driven results, either in the sense of the hardware/software combination of Nvidia and/or AMD, or cybersecurity firms incorporating that technology to secure networks and data from increasingly AI-driven attacks. 2022’s winners – utilities – suffered throughout 2023. The worst performers had small weightings on the index and therefore detracted little from performance.
The Magnificent Seven, with the largest market caps in the Nasdaq, were almost entirely responsible for the index’s total return.
| Symbol | Name | 1M % Change |
| AAPL | Apple Inc | +48.18% |
| MSFT | Microsoft Corp | +56.80% |
| GOOG | Alphabet | +58.83% |
| AMZN | Amazon.com Inc | +80.88% |
| NVDA | Nvidia Corp | +238.87% |
| META | Meta Platforms Inc | +194.13% |
| TSLA | Tesla Inc | +101.72% |
2024 Outlook
The question now is what will 2024 bring? As always, there could not be more divergent views. Many are calling for the standard 10% increase in the S&P 500 by year-end, but with volatility. This is certainly the safest or at least most consensus forecast. Unlike last year, where technical setups helped to predict the outcome, this year we begin at the top. Some are looking at the “rotation” out of the Magnificent Seven as a sign that their time is past, but there should always be reason to buy growth. Second, with passive index investing as the default approach, it is hard to see how the mega-cap leaders do not participate in large part, regardless of the outcome.
Last year the market also enjoyed the second half of the mid-term election cycle – the better half. This year is an election year, and many will want to focus on that as the driver of the market. However, what should be more significant is whether we find ourselves in a rising growth/falling inflation scenario or falling growth/rising inflation scenario. If the first combination is dominant in 2024, then investors should expect to see gains. Second, these conditions favor incumbents and the political impact of the election cycle is somewhat subsumed in the broader economic conditions. Reverse to falling growth/rising inflation and watch how things change at the polls.
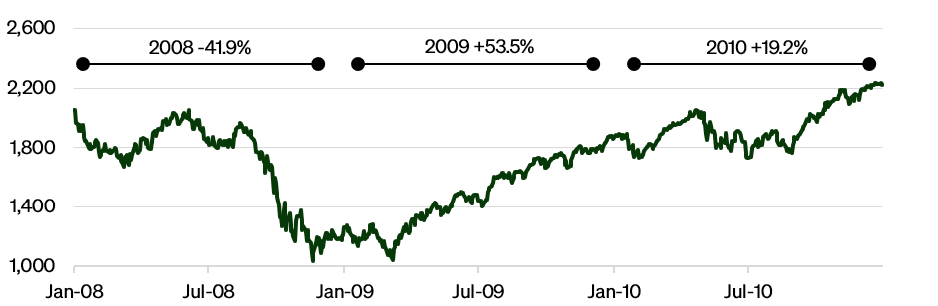
Finally, 2023 was in the unique position of being the first year following the only calendar year where the Nasdaq-100 lost money in each quarter. The years 2009 and 2017 were among the best returns in Nasdaq-100 history after they followed years with three quarters of losses. 2023 outpaced even 2009.
Figure 2: Housing and Unemployment were poor in 2009/10, yet the Nasdaq-100 continued to move higher
Source: Bloomberg
What is worth noting here is that the market recovered quite steadily through 2010, even with shaky economic conditions, especially in housing. The Nasdaq-100 continued to move higher even though unemployment was poor and getting worse throughout most of that period. Housing in our current economy remains an issue with affordability being strained from both a supply and interest rate perspective.
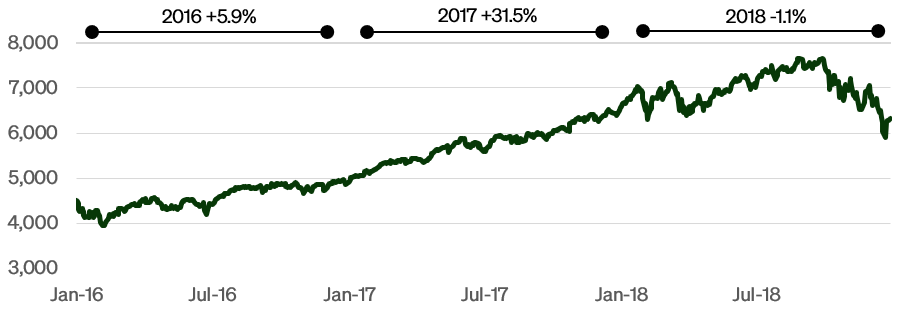
Figure 3: The Fed stopped rate hikes when the market began to slow down
Source: Bloomberg
From 2016 into 2018, the market again recovered quite steadily until it was spooked by continuing Federal Reserve hikes in the face of slowing economic conditions. The Federal Reserve was raising rates modestly, but when they seemed to ignore evidence of an impending economic slowdown, the market moved against them. Once the Fed signaled they would not be raising rates, the market recovered. Once again, the idea of a mean-reversion year seems to lack historical context.
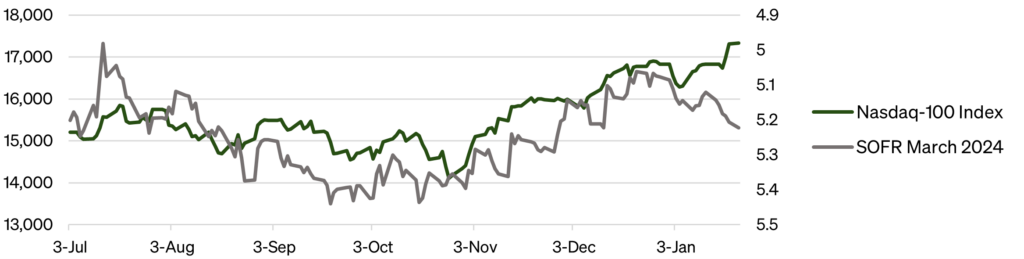
A looming “threat” coming into 2024 is Fed Fund Rate futures pointing to cuts, but with uncertainty as to the number and timing of those cuts. Markets have moved in tandem with projected interest rates, although they have diverged in the last week.
Figure 4: Stocks have largely traded in line with March 2024 Rate Projections
Source: Bloomberg
This is what is nice about a tactical system. We do not have to place our chips down in one spot and hope for the best conclusion twelve months from now. By looking at the market’s action day-by-day, TUG will attempt to cut through the noise and pick up on the trend. In 2023, we began the year in a bearish position; this year we begin fully bullish. The system should deliver the appropriate positioning as all investors wrestle with the news, the expectations, and results of what is surely going to be an interesting year!
Appendix
Investing in ETFs involves risk and there is no guarantee of principal.
To view the prospectus for TUG and TUGN, visit https://stfm.com/wp-content/uploads/2023/07/TUG_summary-prospectus.pdf.
The Nasdaq-100 is a market cap weighted stock market index made up of 101 equity securities issued by 100 of the largest non-financial companies listed on the Nasdaq stock exchange. The Nasdaq-100 Equal Weighted Index is an equal-weighted version of the Nasdaq-100. The S&P 500 is a stock market index tracking the stock performance of 500 of the largest companies listed on U.S. stock exchanges. The Dow Jones Industrial Average is a price-weighted measure of 30 U.S. blue-chip companies. The Nasdaq Composite Index is a market capitalization-weighted index of more than 2,500 stocks listed on the Nasdaq stock exchange.
Cash Redemption Risk. The Funds’ investment strategy may, at times, require it to redeem shares for cash or to otherwise include cash as part of its redemption proceeds. In that case, the Funds may be required to sell or unwind portfolio investments to obtain the cash needed, which may cause the Funds to recognize a capital gain that it might not have recognized if it had made a redemption in kind. Derivatives (Options) Risk. The Funds (for TUGN only) invests in options that derive their performance from that of the Nasdaq-100 Index. Derivatives may be more sensitive to changes in market conditions and may amplify risks. Selling and buying options are speculative activities and entail greater than ordinary investment risks. Fixed Income Risk. Fixed income investments are subject to changes in governmental policy and market conditions, which may cause such investments to be subject to significant volatility and reduced liquidity, depending on the environment. Large-Capitalization Investing Risk. The securities or large capitalization companies may be relatively mature compared to smaller companies and therefore subject to slower growth during times of economic expansion. Management Risk. The Funds is actively managed and may not meet its investment objective based on the Adviser’s success or failure in implementing the Funds’ strategy. Models and Data Risk. When models and data prove to be incorrect or incomplete, decisions made based on them can expose the Funds to potential risks. New Funds Risk. The Funds is recently organized with no operating history and managed by an Adviser that has not previously managed a registered Funds. As such, the Funds has no track record on which to base investment decisions.
STF Management, LP serves as the Funds’ investment adviser.
The Funds are distributed by Foreside Funds Services, LLC. Foreside is not affiliated with STF Management.