TUG & TUGN Update – April 2024

Quarter in Review
- Market Performance | Stocks continued their winter rally as nearly all GICs sectors (Real Estate excluded) finished positive. Large cap information technology and communication service stocks lead the index after a strong earnings cycle while countercyclical utility and consumer staple stocks lagged. While the US labor market remained tight, stubbornly high inflation reports lowered expectations for 2024 rate cuts, causing long term rates to rise.
- Fund Allocation | The funds remained allocated to 100% equities over the entire quarter as the index experienced low volatility and did not suffer a pullback below 3%.
- Leaders | Nvidia (+82.46%) was the pack leader in the AI trade and the index, with Constellation Energy (+58.48%) and Doordash (+39.27%) both up 100% year over year from improved forward earnings guidance.
- Detractors | Tesla (-29.25%) was the worst performing stock in the index while Apple (-10.82%) due to its large cap weighting was the second largest detractor to performance.
- Options Contribution | Due to a smooth, upward climb in the underlying index, the options overlay in TUGN detracted modestly from performance as TUG outperformed TUGN over the quarter.
Let’s return to 2023’s first quarter results.
By the end of March, the index had surprised everyone with one of its biggest returns in the last three decades, up 20.5%. We pointed out that historically this presaged more returns, and in January of this year, wrote that when the Nasdaq-100 Index experiences a quarter of greater than 20% performance, 12 months later, the average gain in the index is 26.4%. However, there was a caveat – fourth quarter volatility during the Dot Com bubble years.
Figure 1: Strong quarters usually precede more returns – not mean reversions (Nasdaq-100 Index)
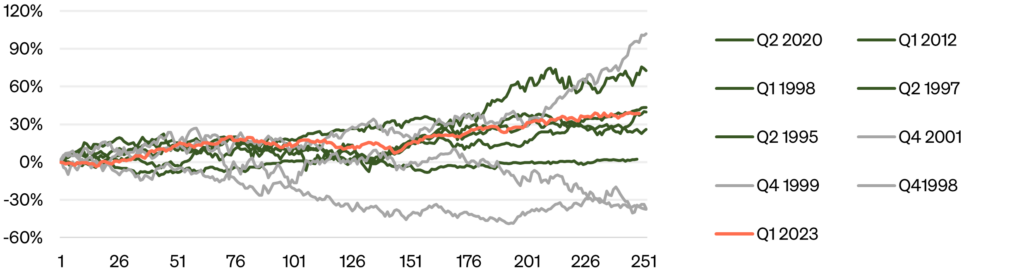
Source: Bloomberg
| Period | Quarterly Return | 12 Month Return |
| Q2 1995 | 20.32% | 25.89% |
| Q2 1997 | 20.10% | 39.70% |
| Q1 1998 | 23.20% | 72.56% |
| Q4 1998 | 36.46% | 101.95% |
| Q4 1999 | 53.99% | -36.84% |
| Q4 2001 | 34.98% | -37.58% |
| Q1 2012 | 20.96% | 2.30% |
| Q2 2020 | 29.99% | 43.30% |
| Q1 2023 | 20.49% | 38.49% |
By removing the fourth quarter results in 1998, 1999, and 2001, the average 12-month performance for the index is now 36.8%. Based on the closed March 2023 Nasdaq-100 price of 13,181, the target index value would therefore be 18,031 at the end of March 2024. That prediction was off by just 223 points, or 1.12%.
Over the past quarter, there is another observation that we speculated on – low volatility. The value of the VIX is not the point – although it too was relatively low – but rather the shallowness of any pullbacks. Even after last year’s great returns, and the chase we saw in the 4th quarter, the Nasdaq-100 never suffered a 3% pullback over the last 90 days. This is very dissimilar to the beginnings of 2010 and 2018, the 5th quarters after poor market years in 2009 and 2016. Given that there has been no movement by the Federal Reserve, the market seems to be drifting up as small pullbacks are purchased by people who missed 2023 and have excess cash in their portfolio.
Figure 2: Two-year Nasdaq-100 Index performance after 3 negative calendar quarters
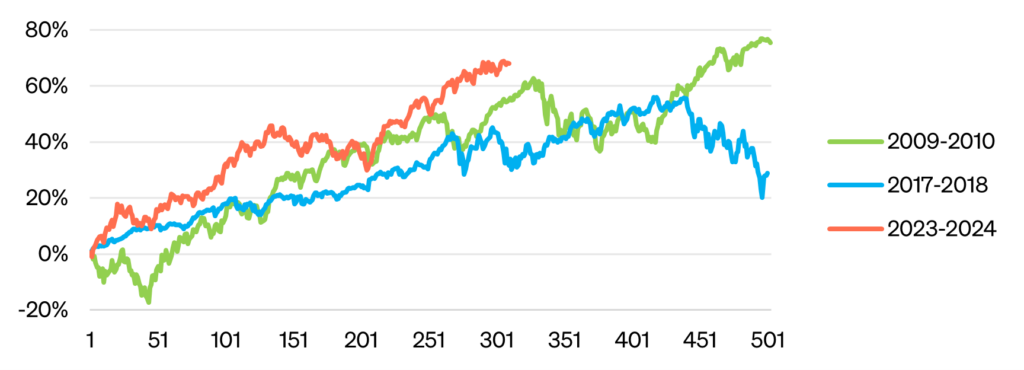
Source: Bloomberg
So, what happened internally to the index? Large cap information technology and communication services stocks continue to lead the way, powered by an incredible 82.5% return from Nvidia. Microsoft remained the largest firm and added 11.88% in price this past quarter, while Apple, at number two, lost 10.93% of its stock price. Tesla continues to weigh down the index, tumbling 29.25% and effectively falling out of the Magnificent 7 grouping of stocks. 63 stocks in the index posted gains versus 40 which posted losses; 36 stocks posted double-digit gains versus 17 which posted double-digit losses.
One sign of a healthy index is a broadening at the top, even as the market caps exceed trillions of dollars. Relative to a year ago, the top 10 stocks make up 8% less of the index. At their peak concentration last summer (before the Nasdaq announced their special rebalance), the top ten made up over 60% of the index.
| Top 10 Index Holdings March 28, 2024 | Top 10 Index Holdings March 31, 2023 | ||
| Microsoft | 8.75% | Microsoft | 12.57% |
| Apple | 7.41% | Apple | 12.34% |
| Nvidia | 6.32% | Alphabet | 7.35% |
| Amazon | 5.25% | Amazon | 6.22% |
| Alphabet | 4.91% | Nvidia | 5.23% |
| Meta | 4.76% | Tesla | 3.86% |
| Broadcom | 4.44% | Meta | 3.60% |
| Tesla | 2.37% | Broadcom | 2.04% |
| Costco | 2.35% | Pepsico | 1.92% |
| Advanced Micro Devices | 2.11% | Costco | 1.68% |
| Total | 48.67% | Total | 56.81% |
One of the main drivers of the stock and bond rally last year was the expectation that cooling inflation would permit the Fed to cut rates in 2024. The PCI reports in January and February suggested those hopes might be too optimistic, and traders responded by pricing in higher yields. Figure 3 shows the S&P 500 returns against the implied January 2025 rate; for the second half of last year, these two indices had traded inversely since stocks performed better with lower interest rate projections.
This year, however, stocks have continued their rally undeterred by higher rate expectations. While some market participants have warned of a looming bubble, US earnings continue to remain strong, the rest of the world, especially among the top tech stocks. The market seems comfortable buying into the rally even with higher rates knowing that the corporate fundamentals look strong. The Fed also has the capacity to lower rates if the economic outlook diminishes. If rates continue to remain high, large companies will continue to be fine as they have largely locked in borrowing. As it stands, rate futures are now trading in line with Fed dot plot expectations, which anticipate three cuts this year.
Figure 3: Stocks continue to rise even though investors expect higher for longer rates1
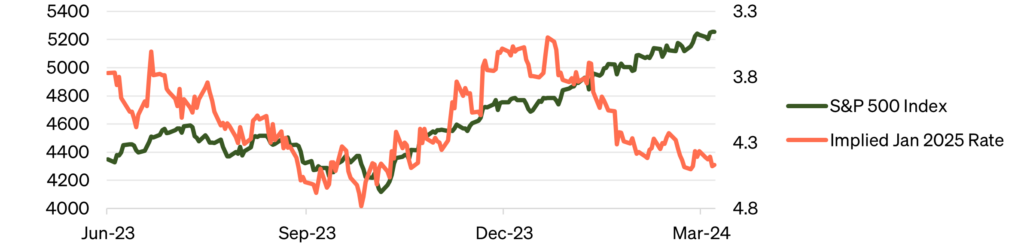
Source: Bloomberg
TUG and TUGN begin this next quarter still fully long the index. The best months for the Nasdaq-100 historically end in June, and given the lack of volatility, it seems likely that the drift continues. We will have earnings reports beginning for our stocks in about three weeks, and if we once again get through the next 90 days without experiencing a pullback of 5%, the course for the year may be set. The most important thing is that great years (2023) are not generally followed by losses or ever mediocre years in some kind of reversion-to-mean trade. And strength at the beginning of a year starts the fear-of-missing-out reflex in investors who sold too early this past quarter, trying to “lock in” gains. Momentum begets momentum. Stay the course.
Appendix
[1] The implied rate is represented by the US0AFR JAN2025 Index.
Investing in ETFs involves risk and there is no guarantee of principal.
To view the prospectus for TUG and TUGN, visit https://stfm.com/wp-content/uploads/2023/07/TUG_summary-prospectus.pdf.
The Nasdaq-100 is a market cap weighted stock market index made up of 101 equity securities issued by 100 of the largest non-financial companies listed on the Nasdaq stock exchange. The Nasdaq-100 Equal Weighted Index is an equal-weighted version of the Nasdaq-100. The S&P 500 is a stock market index tracking the stock performance of 500 of the largest companies listed on U.S. stock exchanges. The Dow Jones Industrial Average is a price-weighted measure of 30 U.S. blue-chip companies. The Nasdaq Composite Index is a market capitalization-weighted index of more than 2,500 stocks listed on the Nasdaq stock exchange.
Cash Redemption Risk. The Funds’ investment strategy may, at times, require it to redeem shares for cash or to otherwise include cash as part of its redemption proceeds. In that case, the Funds may be required to sell or unwind portfolio investments to obtain the cash needed, which may cause the Funds to recognize a capital gain that it might not have recognized if it had made a redemption in kind. Derivatives (Options) Risk. The Funds (for TUGN only) invests in options that derive their performance from that of the Nasdaq-100 Index. Derivatives may be more sensitive to changes in market conditions and may amplify risks. Selling and buying options are speculative activities and entail greater than ordinary investment risks. Fixed Income Risk. Fixed income investments are subject to changes in governmental policy and market conditions, which may cause such investments to be subject to significant volatility and reduced liquidity, depending on the environment. Large-Capitalization Investing Risk. The securities or large capitalization companies may be relatively mature compared to smaller companies and therefore subject to slower growth during times of economic expansion. Management Risk. The Funds is actively managed and may not meet its investment objective based on the Adviser’s success or failure in implementing the Funds’ strategy. Models and Data Risk. When models and data prove to be incorrect or incomplete, decisions made based on them can expose the Funds to potential risks. New Funds Risk. The Funds is recently organized with no operating history and managed by an Adviser that has not previously managed a registered Funds. As such, the Funds has no track record on which to base investment decisions.
STF Management, LP serves as the Funds’ investment adviser.
The Funds are distributed by Foreside Funds Services, LLC. Foreside is not affiliated with STF Management.