TUG & TUGN Update – July 2024

Quarter in Review
- Market Performance | The S&P 500 and Nasdaq-100 moved past a volatile April to finish the quarter higher thanks to large cap information tech and communication services companies. Challenging economic data has hurt smaller companies, leading to a down quarter for the Russell 2000 index. The US labor market has shown signs of weakening although inflation has stayed above the Fed’s 2% goal, which has delayed expectations for the first rates cut to November. 10-year US yields rose in April before falling 40 bps due to improved inflation metrics.
- Fund Allocation | The funds remained allocated 100% to equities over the entire quarter. A 7% pullback in the Nasdaq in April did not meet the fund’s moving average and implied volatility thresholds to reduce equity exposure.
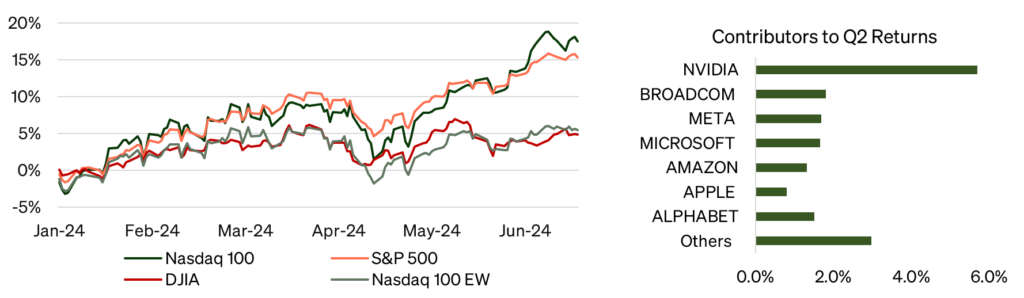
- Leaders | Nvidia (36.7%) was the best performing stock and contributor to the index, with other large cap holdings like Apple (23.0%), Broadcom (21.5%), and Alphabet (20.8%) contributing to returns.
- Detractors | Walgreens (-43.5%) was the worst performing stock in the index while Intel (-29.6%) and AMD (-10.1%) were the largest detractors to performance due to position size.
- Options Contribution | The active options program in TUGN outperformed a passive Nasdaq-100 buy-write call index by 5.1%. TUGN modestly underperformed TUG due to the strong performance in the underlying index.1
Further review of the second quarter results shows that the Nasdaq-100 Index was up a total of 8.02%, bringing its year-to-date gains to 17.47%. Although over half of the index was positive for the quarter, the largest market weighted stocks continue to drive the majority of returns.
Figure 1: Contributions to returns are skewed to the largest index weighted companies
| Stock | Quarterly Return | Contribution to Index Return |
| Nvidia Corp | 36.74% | 2.36 |
| Apple Inc | 22.99% | 1.75 |
| Broadcom Inc | 21.53% | 0.94 |
| Alphabet Inc (Class A) | 20.82% | 1.06 2 |
| Crowdstrike Holdings Inc | 19.53% | 0.10 |
| Lululemon Athletica Inc | -23.54% | -0.08 |
| Sirius XM Holdings Inc | -23.83% | -0.03 |
| Intel Corp | -29.60% | -0.42 |
| MongoDB Inc | -30.30% | -0.06 |
| Walgreens Boots Alliance Inc | -43.45% | -0.01 |
The difference between the winners and losers in the index is their effect on the index weighting. 25 stocks gained over 10% while 24 lost more than 10%. 54 companies were positive while 49 were negative. As of quarter end, Nvidia was up an astounding 150% this year and as a result is the third largest stock with a market cap of ~$1.9 trillion. Walgreens had the worst performance in the index (a sign of trouble for the larger pharmacy business), but its effect at a $14 billion market cap was barely noticeable.
While this seems like an even split, the Nasdaq-100 is a market-cap weighted index, so the trillion-dollar companies like Nvidia, Apple and Alphabet carry more influence. Therefore, we see the Nasdaq-100 equal weight actually declined 0.2% in Q2 and the underperformance accounted for by the narrowing of the trade. Even as the Nasdaq-100 reached for all-time highs, within the index fewer stocks reached new highs across near (3M), intermediate (6M), and longer term (12M) time frames.
Figure 2: Market cap weighted indices are outperforming YTD
Source: Bloomberg
It was not just returns and higher prices that were concentrated; trades were, too. While Nvidia accounted for 36.7% of the trading volume for the Nasdaq-100 in the first half of the year, it represents just 7.8% of the index weighting. Other stocks that saw exceptional volume were Tesla (7.4% of all trades), Apple and AMD (5.0% each), and Intel (3.6%). Each of these stocks traded above their weighting in the index except for Apple. Nvidia’s trading volume shows how much the AI story is moving the needle for investors as AI and microchip stocks volumes continue to dominate global fund flows.
While breadth in the market was not terrible – 70% of the stocks in the S&P 500 were above their 200-day moving average – the primary drivers of the market were undoubtedly narrow. However, history seems to suggest there may be more gas left in the tank for this bull rally. Strong earnings growth for the AI companies continues to justify the higher prices and an overweight allocation to the sector. Earnings per share for the Magnificent Seven index have increased 187% since the beginning of 2021 compared to 55% for the S&P 500 index. Even with its incredible price expansion, Nvidia is not the most expensive stock in this group of seven on a price to earnings basis. In fact, its peak multiple has not come close to Cisco’s notoriously high P/E in 2000. Even though the price action has looked eerily similar, Nvidia’s forward P/E is actually down from last year even with a 150% stock price increase.
Figure 3: Nvidia’s stronger earnings help justify its incredible price increase
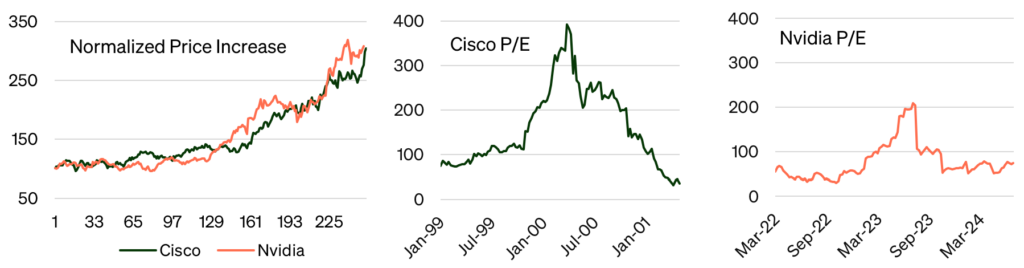
Source: Bloomberg
Longer term returns also stand out from notable market bubbles. The S&P 500 has appreciated about 85% over the last 5 years, but this impressive run does not come close to the blow off peaks of the 1920s and 1990s bubbles. Given that many investors have watched the rally while sitting in 5% money market accounts, the impatience and fear of missing out may drive many participants to buy, rather than sell in the event of a 5-10% correction. There is optimism that this year’s momentum may carry on through the end of the year.
Figure 4: A long-term perspective of S&P 500 returns doesn’t suggest a repeat of the Dot Com crash
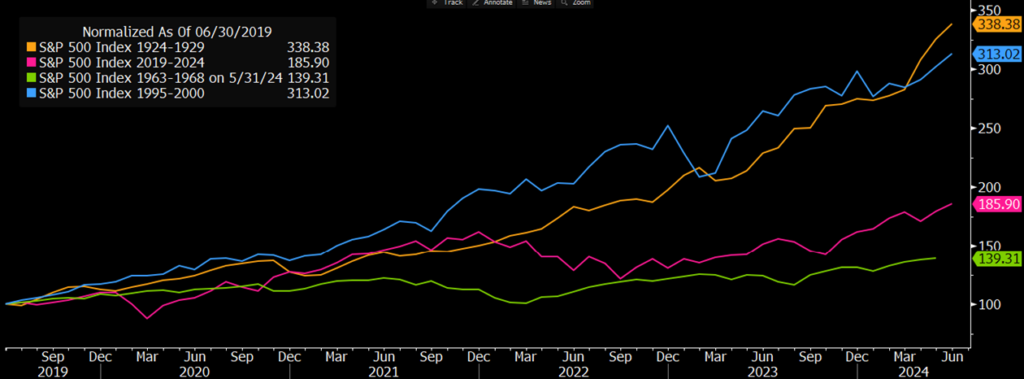
Source: Bloomberg Intelligence
Finally, the upcoming presidential election adds an extra wrinkle to the end of year forecast. For the sitting president, the economy is a key component to their reelection bid, so they have strong incentives to ensure good employment and economic news. Regardless, a bumpy late summer or fall may be in the cards given the markets recent history. 2020 was a similar environment, with technology stocks ripping higher in late summer while overall volume remained low. The index fell 12% in a month, breaking through the 50 DMA before bouncing off the 100 DMA right before election day in November.
September and October have been bad months both historically and recently, as the market experienced a 10% drawdown in 2023. In both 2020 and 2023, the index began to decline after returning over 40% YTD, so part of this may simply be par for the course. While implied volatility remained high in the aftermath of Covid-19, stocks recovered quickly as investors responded positively to the massive fiscal relief thrust upon the economy. This election cycle, we may see similar relief in the form of rate cuts as neither candidate will prefer to be associated with growing levels of unemployment.
Other developed economies are already started their rate descent, and the expectation is that the United States will lower once or twice this year.
Will we test the 100 DMA within the next 100 days? From its current position, that is an ~11% drop, presenting a near term potential risk. However, the greatest challenge the market has presented over the last 5 years is not when to de-risk, but when to re-deploy. Instead of trying to discern and time these events yourself, allow the TUG algorithm to work for you – every day, without emotion, without the average investor’s vacillation between fear and greed. TUG and TUGN offer a hedged equity solution in a packaged product while investors await clarity from the US election. Continue to allow them to do the work they are designed to do.
Appendix
[1] The Cboe NASDAQ-100 BuyWrite Index (BXN) is a benchmark index designed to track the performance of a hypothetical buy-write strategy on the NASDAQ-100. The BXN Index returned 1.74% from 03/28/24 – 06/28/24.
[2] Both classes of Alphabet stock have been included for total contribution.
To view the prospectus for TUG and TUGN, visit https://stfm.com/wp-content/uploads/2023/07/TUG_summary-prospectus.pdf.
For a list of the top 10 holdings in TUG and TUGN, please visit https://stfm.com/etf/tug/ and https://stfm.com/etf/tugn/.
The Nasdaq-100 is a market cap weighted stock market index made up of 101 equity securities issued by 100 of the largest non-financial companies listed on the Nasdaq stock exchange. The Nasdaq-100 Equal Weighted Index is an equal-weighted version of the Nasdaq-100. The S&P 500 is a stock market index tracking the stock performance of 500 of the largest companies listed on U.S. stock exchanges. The Dow Jones Industrial Average is a price-weighted measure of 30 U.S. blue-chip companies. The Nasdaq Composite Index is a market capitalization-weighted index of more than 2,500 stocks listed on the Nasdaq stock exchange.
Cash Redemption Risk. The Funds’ investment strategy may, at times, require it to redeem shares for cash or to otherwise include cash as part of its redemption proceeds. In that case, the Funds may be required to sell or unwind portfolio investments to obtain the cash needed, which may cause the Funds to recognize a capital gain that it might not have recognized if it had made a redemption in kind. Derivatives (Options) Risk. The Funds (for TUGN only) invests in options that derive their performance from that of the Nasdaq-100 Index. Derivatives may be more sensitive to changes in market conditions and may amplify risks. Selling and buying options are speculative activities and entail greater than ordinary investment risks. Fixed Income Risk. Fixed income investments are subject to changes in governmental policy and market conditions, which may cause such investments to be subject to significant volatility and reduced liquidity, depending on the environment. Large-Capitalization Investing Risk. The securities or large capitalization companies may be relatively mature compared to smaller companies and therefore subject to slower growth during times of economic expansion. Management Risk. The Funds is actively managed and may not meet its investment objective based on the Adviser’s success or failure in implementing the Funds’ strategy. Models and Data Risk. When models and data prove to be incorrect or incomplete, decisions made based on them can expose the Funds to potential risks.
STF Management, LP serves as the Funds’ investment adviser.
The Funds are distributed by Foreside Funds Services, LLC. Foreside is not affiliated with STF Management.